
Excessive Fertiliser Use On Kiwifruit Orchards
We have noticed an increase in symptoms of leaf breakdown disorder or vine decline. Symptoms include yellowing leaves, scorched or necrotic leaves, premature leaf drop and reduced OGR.
See more photos and information on leaf breakdown/vine decline disorder here.
We believe there is a link between these symptoms and the over-fertilization of kiwifruit orchards.
This Is A Serious Problem That Growers Must Address Now.
Over-fertilisation is already costing growers money as they treat a toxicity problem with one nutrient only to create another problem – throwing good money after bad.
As this continues we are affecting the soil and will gradually reduce the economic viability of our land.
You must ask yourself if the fertiliser and foliar nutrient products you are encouraged to buy are in the best interests of your orchard and will benefit your income.
Add fertiliser only when needed. Chose any products you like and purchase them from any company you like but please review 3 things before you apply more fertiliser:
Your soil tests and current levels
The medium, or desired, levels
The recommendations you have been given for fertiliser application and how they compare to your current levels and the desired range.
Then – only apply enough to bring your orchard into the mid point of the desired/medium range.
* A 4th important aspect is cation exchange capacity and base saturation. This affects pH, soil structure, nutrient availability and nutrient interactions. Qualified advisors use formulae to predict nutrient availability and retention in the soil and will provide recommendations based on these calculations.
We have reviewed soil tests from some kiwifruit orchards and many are already in the high range (some are even off the scale). We have also reviewed the “desired” levels which are often higher than is truly necessary for kiwifruit orchards. We then reviewed the fertiliser recommendations and they are often wildly incorrect – recommending massive amounts of fertilisers when nutients are already in the desired or high (toxic) range.
We present 2 case studies below.
EXAMPLE - In the case study below, potassium levels are literally off the chart.
Test results found there to be 1.82mg/L (medium/desired range is 0.6-1.2mg/L).
The recommendation from the fertiliser company?
ADD MORE: 250kg per hectare of potassium sulphate and 100kg per hectare of SOP.
There is a lot of misinformation in the industry that suggests more fertiliser is a good thing. That high levels means “high fertility” and growers should aim for “excellent levels”.
Excessive fertilisers are harmful to your vines and crop just as under-fertilisation is. The difference is that under-fertilisation can be relatively easily fixed. Over fertilisation leads to accumulation, soil salinity, leaf breakdown and poor soil health. This takes longer to rectify and will lead to lower yields and poor fruit storage.
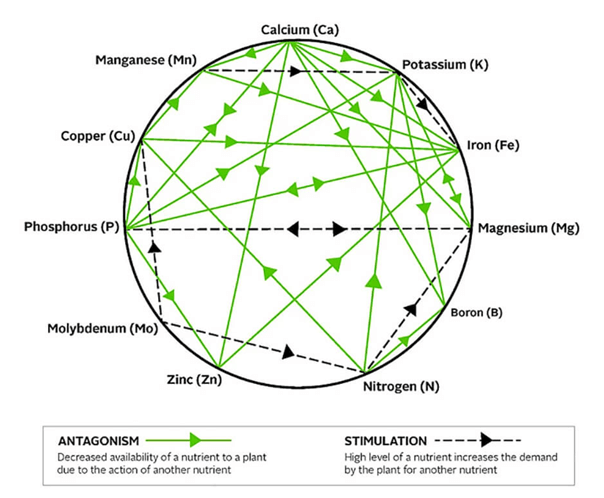
This is Mulder’s Chart which shows how soil nutrients interact with one another and affect uptake by plants. This shows that growers are led into a circular problem – by applying too much of one nutrient the plant needs more of other nutrients or other nutients become less available causing a deficiency.
The result is that the grower is constantly chasing their tail, trying to correct the problem by applying more and more fertiliser. Meanwhile, the plants are under stress and the crop suffers.
Please review your results and, if you are unsure, ask for independent advice.
Case Study 1
Soil test results were presented in lbs/acre. This should have been converted to kg/hectare before being passed on to the grower. We have converted the results to kg/ha before analysing the recommendations.
These results are apparently used to recommend a total of 13 fertiliser products to “partly satisfy” an “excellent level”.
However it is difficult to see a connection between the recommendations and desired levels.
The results clearly show no phosphate (P) or potassium (K) deficiency.
Analysing the results and recommendations vs desired levels we found the following: (Soil test results and recommendations as supplied by the fertiliser company can be viewed in full here).
Compare these recommendations to what apple orchardists apply: The following table is derived from a PhD project by Allan Morton (Effects of fertiliser nitrogen on fruit quality of kiwifruit fruit, PhD project, Massey University)
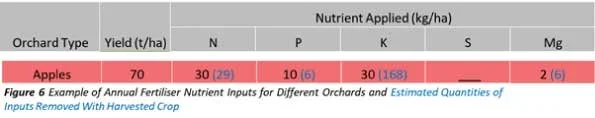
Assuming a similar t/ha of crop is removed from kiwifruit orchards and allowing for some variation in nutritional needs of apples vs kiwifruit:
if an apple crop of 70 t/ha removes just 6 kg/ha of P. Why is it necessary to add bring the P level up to 511 kg/ha on a kiwifruit orchard?
if an apple crop of 70 t/ha removes 168 kg/ha of K. Why is it necessary to add bring the K level up to an incredible 963 kg/ha on a kiwifruit orchard?
Case Study 2
Soil Test Results
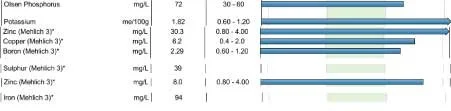
Note all levels are in the high (toxic) range and potassium and zinc are off the chart.
You would expect the recommendations for these nutrients to be minimal – or perhaps products to compensate for the various nutrients that are already too high. Certainly not more of the same…
Recommendations from Fertiliser Sales Person:
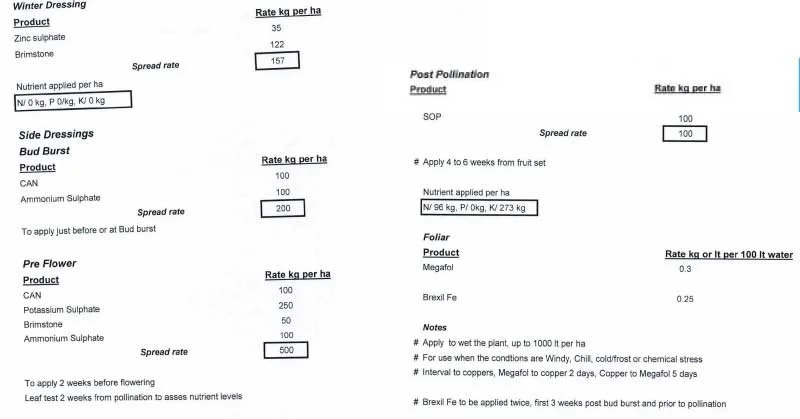
A total of 11 products including:
an additional 273kg/ha of potassium (already off the chart)
more zinc (already off the chart) in the form of 35kg/ha of zinc sulphate
Brimstone (sulphur). Possibly due to this label claim: “Deficiency is commonly seen as yellowing of plants due to its role along with nitrogen in protein synthesis.”. This suggests premature yellowing of leaves is being blamed on a sulphur deficiency.
Megafol which contains boron (already in the high (toxic) column)
Brexil Fe despite no evidence of an Fe deficiency
Again, the recommendations do not seem to be based on the desired/required levels.
At these levels the plant is under stress (see Mulder’s Chart) and the crop suffers.